
Caselets in Data Interpretation
Caselets in Data Interpretation: Overview
This topic covers concepts, such as, Common Data of Caselets for Data Interpretation, Approach to Solve Caselets, Using Venn Diagrams to Solve Caselets, Using Tabular Method to Solve Caselets & Mix Graph etc.
Important Questions on Caselets in Data Interpretation
Study the following graph and answer the questions given below:
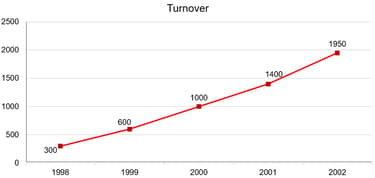
The following line graph shows the turnover (in crores),
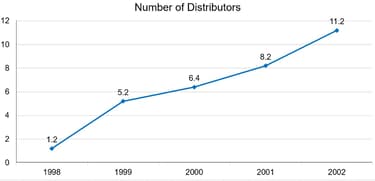
The below line graph shows the number of distributors (in lakhs) in the direct selling business.
The following table gives information about the top four companies in the direct selling business.
| Rank | Company | Turnover in (in crore) | No. of distributors in (in lakhs) |
| 1 | Wamay | ||
| 2 | Codimare | ||
| 3 | Nova | ||
| 4 | Balife |
Balife was launched in . Since then, the number of its distributors is increasing by every year and its turnover by , then what was the turnover-to-number of distributors ratio of Balife during its launching year?
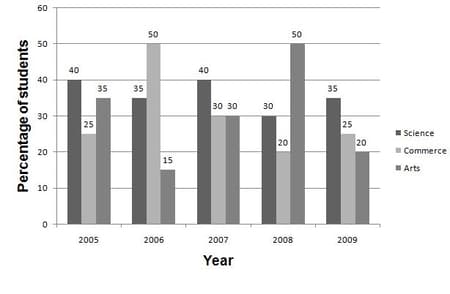
Following bar graph shows the percentage of total number of students admitted in different streams in a college during the period of . The table shows the total number of admitted students during this period.
| Year | Total number of students admitted |
What is the ratio between number of years in which Science students admitted is more than Commerce students and the number of years in which Arts students admitted is more than Commerce students admitted?
Study the following graph and pie-chart carefully and answer the question given below:
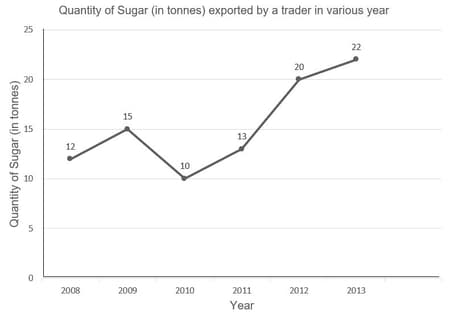
The line graph below represents the quantity of sugar (in ) exported by a trader in various years.
The bar graph below shows the value of exports in various years (in )
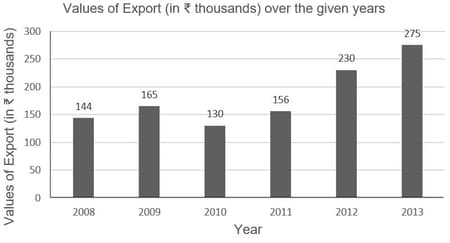
In how many years the quantity of sugar exported is more than the average quantity of sugar exported for the given period?
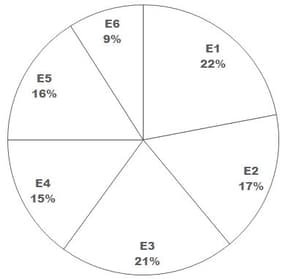
Read the following pie chart and table carefully and answer the question given below.
Percentage of population in seven states in :

| States | Percentage of population below the poverty line |
| A | |
| B | |
| C | |
| D | |
| E | |
| F | |
| G |
If in , the total population of the seven states was , what will be the population of state F in that year (below poverty line)?
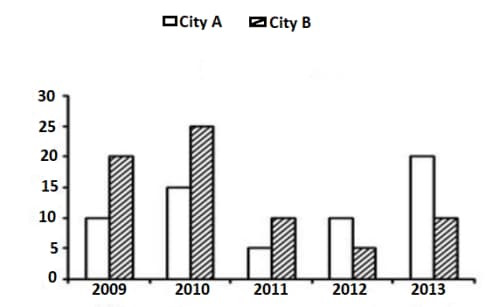
Read the following graph and table carefully and answer the question given below.
Percentage increase in the population of two cities in different years:
| Population of both city in | |
| City | Population (In Lakh) |
| A | |
| B | |
The population of city B at the end of is approximately what percent of the population of city A at the beginning of the year
The question is based on the following data:
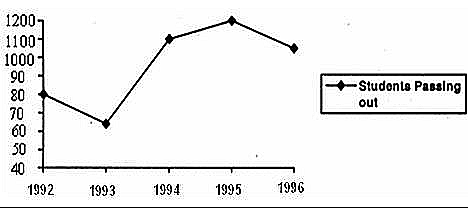
The first table gives the percentage of students in the class of M.B.A. who sought employment in the areas of Finance, Marketing and Software. The second table gives the average starting salaries of the students per month in these areas.
| Finance | Marketing | Software | Others | |
| 1992 | 12 | 36 | 19 | 23 |
| 1993 | 17 | 48 | 23 | 12 |
| 1994 | 23 | 43 | 21 | 23 |
| 1995 | 19 | 37 | 16 | 28 |
| 1996 | 32 | 32 | 20 | 16 |
| Finance | Marketing | Software | |
| 1992 | 5450 | 5170 | 5290 |
| 1993 | 6380 | 6390 | 6440 |
| 1994 | 7550 | 7630 | 7050 |
| 1995 | 8920 | 8960 | 7760 |
| 1996 | 9810 | 10220 | 8640 |
What is the average monthly salary offered to a management graduate in the ?
Directions : In the following pie-charts the percentage of different categories of employees of two companies are given and the table shows the percentage of Male employees among them. The total employees in Company is and that in Company is
Company
Company
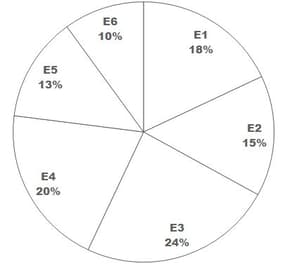
The table is given below:
| Male in | Male in | |
What is the average number of male employees of all categories in Company
Study the following pie chart carefully to answer the question.
Degree-wise breakup of employees working in various departments of an organisation and the ratio of Men to Women
Total Number of Employees
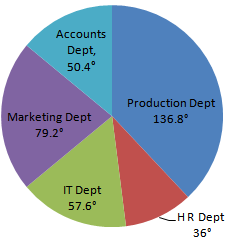
Dept Department
Respective Ratio of Men to Women in Each Department
| Department | Men | Women |
| Production | ||
| HR | ||
| IT | ||
| Marketing | ||
| Accounts |
What is the respective ratio of the number of women working in the HR department and the number of men working in the IT department ?
Read the following graph carefully and answer the question given below.
Number of male and female professors in different discipline in a University
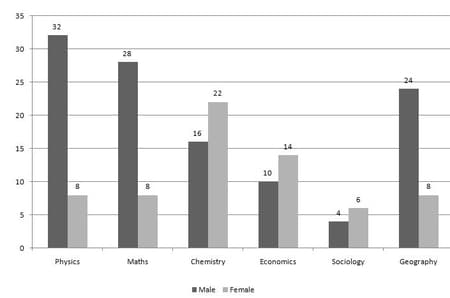
The age of Physics Professor is shown below:
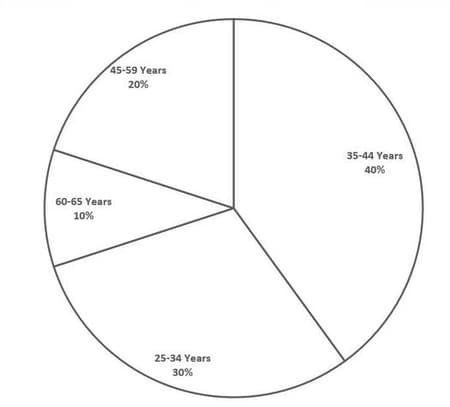
How many Physics professors belong to the age group
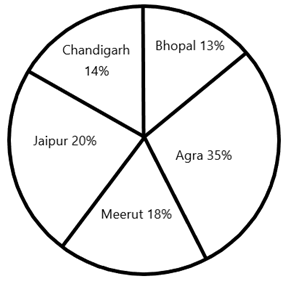
Read the following pie chart and table carefully and answer the questions given below.
Total number of listeners
Percentage of listeners in different cities:
Percentage of listeners of different FM channels in different
| City | Radio Mirchi | Radio City | Red FM | FM Gold | Rainbow |
| Agra | |||||
| Meerut | |||||
| Jaipur | |||||
| Chandigarh | |||||
| Bhopal |
What is the number of listeners of Radio city in Meerut?
Study the following graph carefully and answer the questions —
Distribution of seats in states
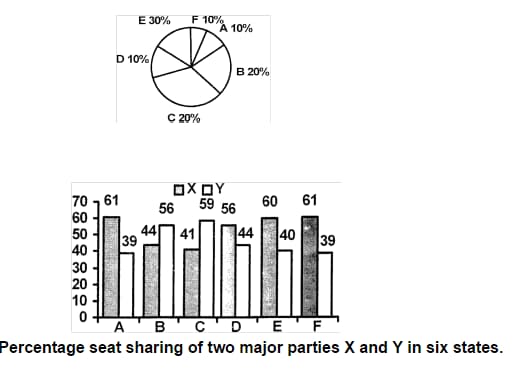
In which state the number of seats won by Y is maximum?
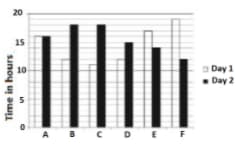
Study the following graph and table carefully and answer the question given below:
Time taken to travel (in hours) by five vehicles on two different days:
Distance covered (in km) by five vehicles on each day:
| Vehicle | Day | Day |
| A | ||
| B | ||
| C | ||
| D | ||
| E |
What is the respective ratio between the speeds of vehicles D and vehicle E on day ?
Read the following pie-chart and table carefully and answer the question given below.
Percentage distribution of cars produced by companies in :

Total number of cars Lakhs
Percentage sale of these companies
| Company | Sale |
| A | |
| B | |
| C | |
| D | |
| E | |
| F |
What is the number of cars sold by company B?
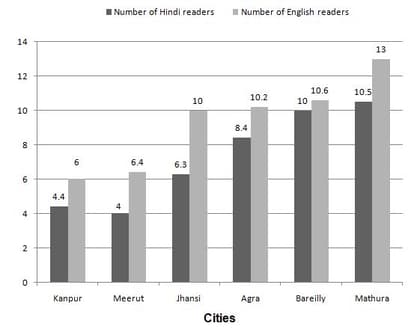
Read the following graph and table carefully and answer the question given below:
Number of Hindi and English newspaper readers (in thousands) in cities
The table of male and female ratio is as follows:
| Cities |
Hindi Male:Female |
English Male:Female |
| Kanpur | ||
| Meerut | ||
| Jhansi | ||
| Agra | ||
| Bareilly | ||
| Mathura |
What is the respective ratio of number of Hindi male reader in Bareilly and number of English male readers in the same city?
Following pie chart shows the percentage share of cost of production by six computer system manufacturers. Total cost of production is crores. The table shows the ratio of production of Desktop and Laptop systems and percentage profit earned on these two type of system by these six companies.
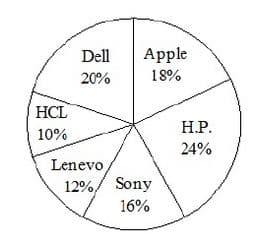
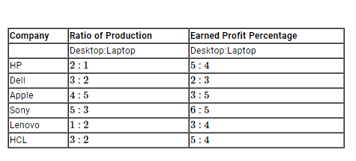
What is the ratio between profit earned on Desktop and Laptop by HCL?
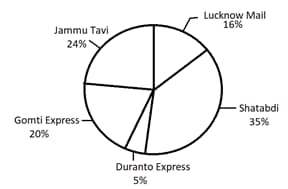
Read the following pie-chart and table carefully and answer the questions given below.
Total number of passenger
Percentage of passengers travelling in different trains:
| Train | Number of male passengers |
| Shatabdi | |
| Duranto Express | |
| Gomti Express | |
| Jammu Tavi Express | |
| Lucknow Mail |
The number of male passengers in Lucknow Mail is approximately what percentage more than the number of female passengers in Gomti Express?
Study the pie chart and table carefully and give the answer to the following question:
The below pie chart gives the information regarding the expenditure of a country over the various games.
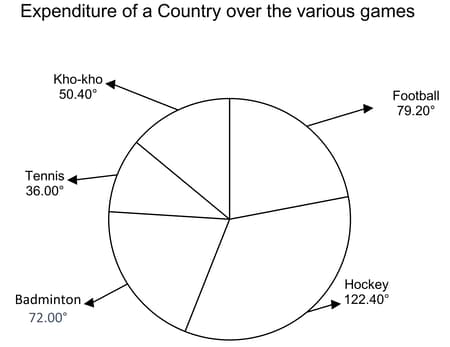
The table given below represents the respective ratio of male to female players involved in these games.
| Games | Ratio of Male:Female |
| Tennis | |
| Kho-Kho | |
| Football | |
| Hockey | |
| Badminton |
What is the ratio of expenditure on Kho-Kho to the expenditure on Tennis?
Study the graphs carefully to answer the question.
Total Number of Children in different School and Percentage of Girls in them:
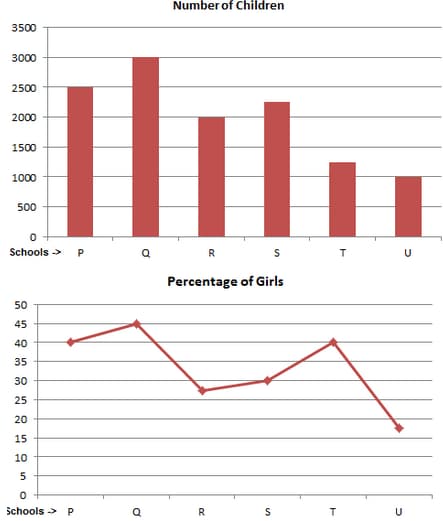
The total number of students in school R is approximately what percent of the total number of students in school S?
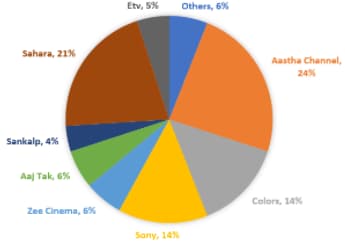
Read the following graph carefully and answer the question given below.
Topmost Indian channels distribution on the basis of viewers:
Average channel viewed by viewers per week (in minute):
| Channels | Minutes |
| Aastha | |
| Colors | |
| Sony | |
| Zee Cinema | |
| Aaj Tak | |
| Sankaip | |
| Sahara | |
| Etv | |
| Others |
All viewers who watch Etv also watch Zee Cinema, what percentage of Zee Cinema viewers view Etv?
Study the following pie-charts and table to answer these questions.
State-wise details of Adult Population of a Country
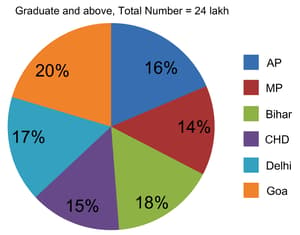
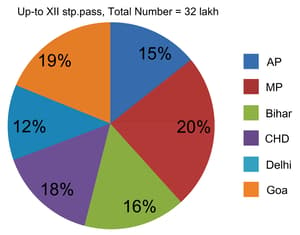

| State | Graduate & Above | Up to XII std. Pass |
| M: F | M: F | |
| AP | ||
| Bihar | ||
| CHD | ||
| Delhi | ||
| Goa | ||
| MP |


